
Researchers gave 125 students the same energy drink and the same 15 word puzzles. One group was told the drink cost $1.89, its normal shop price. The other group was told the university had bought it at a discount, and that it cost $0.89.
The full-price group solved 9.5 puzzles. The discount group solved 7.7. A separate group who drank nothing at all solved 9.1.
So price does not only change what people say about a product. In that experiment it changed what they were able to do with it.

The price-quality heuristic is the name for judging a product by its price tag
The belief that an expensive thing is a better thing has been named, measured and argued about for seventy years.
- The price-quality heuristic is the habit of treating a higher price as a sign of higher quality. A "heuristic" is a mental shortcut, a fast rule people use instead of checking.
- Deliberately setting a high price to trigger the price-quality heuristic is called prestige pricing, or premium pricing.
- Economists call the price-quality heuristic price signalling, meaning the price carries information the buyer cannot check for themselves.
- A "Veblen good" is the extreme version, a product that sells more as it gets more expensive. Named after Thorstein Veblen, who described conspicuous spending in 1899.
- The opposite problem also has a measurement, the "too cheap" price, which is the point where a low price makes buyers doubt the product. It is one of the four questions in the Van Westendorp survey further down this page.
All of those describe the same shortcut from different sides. The rest of this article measures how strong the shortcut actually is, and where it stops working.

Price explains about 12% of what people think of a product's quality
The first proper count of the price to quality effect pooled every published experiment that had measured it.
- Rao and Monroe pooled 54 measured price-to-perceived-quality relationships in 1989 and found a mean effect size of 0.12. That means price accounted for about 12% of the differences in how people rated quality.
- The price to perceived quality effect was positive and reliable for consumer products, so it was real rather than chance.
- The brand name on the product moved perceived quality about as much as the price did.
- The name of the shop selling the product had a small effect that could have been chance.
- A bigger gap between the prices being compared produced a bigger difference in perceived quality. So the size of the price rise matters, not just the direction.
12% is a real effect and a modest one. It says price is one of several things buyers read, not the only one.

The same wine scored higher at $90 than at $10 inside the same person's brain
In 2008 a team put 20 people in a brain scanner and gave them wine to taste through a tube.
- Each wine taste was labelled with a price, and the prices shown were $5, $10, $35, $45 and $90.
- There were only three wines, because two of them were poured twice at two different prices. One wine was served at both $90 and $10. Another was served at both $45 and $5.
- How pleasant people said the wine tasted rose with the price on the label, at a correlation of 0.59, where 0 would mean no link at all and 1 would mean a perfect one.
- Brain activity rose in the medial orbitofrontal cortex, a part of the brain that tracks how much you are enjoying something. So the higher price did not only change what people said, it changed a physical measurement.
- After the scan the same people tasted the same wines with no prices shown, and reported no differences between them at all.
- Twenty people is a small study, so treat the brain measurement as a demonstration rather than a settled size.

A $2.50 placebo pill beat a $0.10 placebo pill by 85% to 61% on pain relief
The strongest version of the price to quality effect was not published in a marketing journal. It was published in a medical one.
- 82 volunteers were told they were testing a new painkiller similar to codeine. Every pill handed out was a placebo, which is a pill with no medicine in it.
- Half were told the pill cost $2.50 each, and half were told it had been discounted to $0.10 each.
- Researchers gave electric shocks to the volunteers' wrists before and after the pill, and asked how much they hurt.
- 85% of the expensive-pill group reported less pain, against 61% of the cheap-pill group.
- The study appeared in JAMA in 2008, a medical journal, so it was reviewed as medicine rather than as marketing.
Nothing physical separated the two groups. The only difference was a number on a sheet of paper.

A discounted energy drink made people solve fewer puzzles than drinking nothing
The energy drink experiment is worth the full detail, because it is the one that measured behaviour rather than opinion.
- 125 students drank a SoBe Adrenaline Rush and were then given 30 minutes to solve 15 word puzzles.
- One group signed a form saying they were charged $1.89, the normal shop price, and the other signed a form saying $0.89 because the university had bought at a discount.
- The full-price group solved 9.5 puzzles and the discount group solved 7.7.
- A separate group of 31 students who were given no drink at all solved 9.1 puzzles. So the discounted drink left people worse off than no drink.
- The energy drink result ran through what people expected, because the discount group rated the drink weaker before starting, at 3.5 out of 7 against 4.3, and then solved even fewer puzzles at 5.8.
- A second experiment gave the same drink before a gym workout, and the discount group rated their own workout less intense and rated themselves more tired.
Price did not change the drink. It changed what the drinker expected the drink to do, and the expectation did the rest.
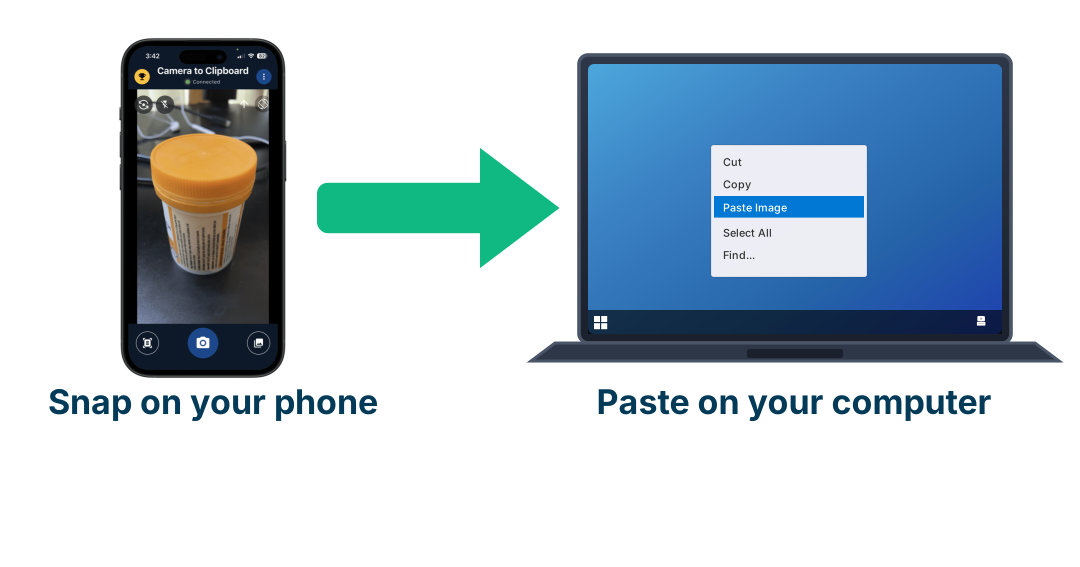
Use Camera to Clipboard to put your rivals' prices on your computer screen
Before you can decide whether your price looks cheap or expensive, you need every competing price in one place, and most of them live on shelf tags, printed menus, product boxes and other people's phone screens. Camera to Clipboard, one of my own apps, takes a photo on your phone and puts it straight into your computer's clipboard, so the next thing you press is paste.
- A photo taken on the phone lands in the computer's clipboard within seconds, so a shelf tag goes straight into the spreadsheet you are building. The photo is also saved into a Camera-to-Clipboard folder in Downloads, so nothing is lost if you paste somewhere else first.
- Batch mode sends several photos at once and copies all of their file paths together, which suits a whole aisle or a whole price list.
- The transfer runs directly between your phone and your computer over your own network, and the photo is encrypted on the way.

Price explains only 4% of the quality gap between two competing brands
Buyers believe price predicts quality. Independent laboratories have been checking whether it does since the 1950s.
- Across more than 65 years of comparative product tests, the average correlation between price and measured quality is about 0.2.
- A correlation of 0.2 means about 4% of the price difference between two competing brands is explained by quality, and the other 96% is explained by something else.
- Riesz found an average correlation of 0.09 across 679 packaged food categories in 1979.
- Riesz's wider sample of 685 durable and non-durable categories averaged 0.26.
- Oxenfeldt's 35 categories in 1950 averaged 0.25, with individual categories running from 0.82 down to negative 0.81. A negative figure means the more expensive product tested worse.

Toyota is the most reliable car brand and Mercedes is the last of the 19 ranked
Cars are the clearest test of whether price predicts quality, because the prices are far apart and the reliability is measured by somebody with no stake in the answer.
- In Consumer Reports' 2026 brand rankings Toyota placed first for reliability, Subaru second and Lexus third.
- Mercedes placed nineteenth, last of the 19 brands ranked, while costing several times what a Toyota costs.
- Volkswagen placed sixteenth, Volvo fifteenth and Audi thirteenth, so the pattern is not one unlucky brand.
- BMW placed fifth overall and first among luxury brands, with Porsche second among luxury brands, so expensive does not automatically mean unreliable either.
- Asian brands averaged 56 points out of 100 and American brands averaged 41, which is a bigger gap than price explains.
Inside one product category, with one measuring organisation, price tells you almost nothing about how often the thing breaks.

A high price raises what buyers expect every time and what they think afterwards almost never
The famous wine and pill experiments are small and old. In 2023 a team re-ran the same test with much larger groups and with products nobody had tested before.
- Kurz, Efendic and Goukens ran six studies covering 2,842 people and published the result in Psychology and Marketing.
- In every one of the six studies a higher price raised what people expected the product's quality and enjoyment to be.
- None of the six studies found a consistent effect on quality and enjoyment once people had actually used the product.
- Kurz and colleagues concluded the marketing placebo effect may be less robust and less general than earlier work assumed.
- Those six studies used bigger samples and less-studied products than the wine and pill experiments, which is why the disagreement matters.
That split is the whole practical answer. A higher price helps you win the sale, and does nothing to help you keep the customer.

The price to quality effect has shrunk since 1989 and is weakest for services
A second meta-analysis pooled the studies published between 1989 and 2006 and asked what changes the size of the effect.
- Voelckner and Hofmann found the effect of price on perceived quality has decreased over the years covered.
- The price to quality effect is weaker for services than for physical products.
- The price to quality effect is weaker for durable goods, meaning things a buyer keeps for years.
- The price to quality effect is weaker for people who are already familiar with the product.
- The price to quality effect is stronger for higher-priced products, so it grows as the numbers grow.
- How many other clues the buyer had available did not change the price to quality effect, which surprised Voelckner and Hofmann.
The people who already know your product are the group the price to quality effect works on least.
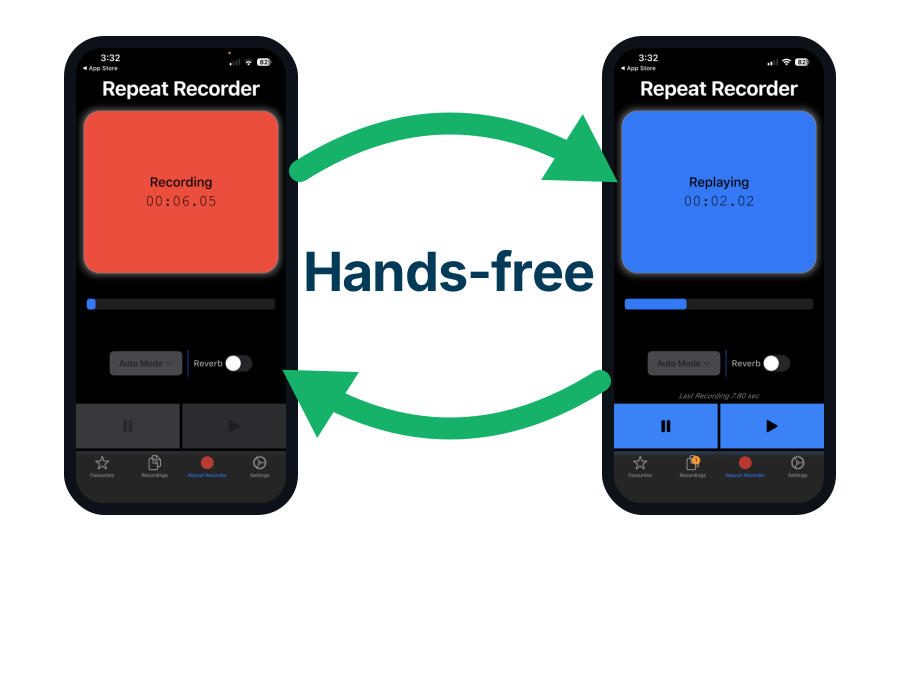
Use Repeat Recorder to rehearse saying your new price without apologising
The hard part of charging more is not the arithmetic. It is saying the new number out loud, on a call or in a video, without your voice adding a discount to it. Repeat Recorder, another of my own apps, records you and plays the take straight back a second later without you touching the phone.
- Automatic mode starts recording when you speak and replays when you stop, so one sentence can be said twenty times without touching the screen. Hearing yourself say a number half a dozen times is the fastest way to find out whether you believe it.
- Hearing the take back one second later is the point, because a normal recorder makes you stop, find the file and press play, by which time you have forgotten what you wanted to fix.
- Takes worth keeping go into favourites and into folders you name yourself, so the old price and the new price sit side by side for comparison. The evidence above says a buyer's expectation is set before they use the product, and your voice is part of that expectation.

Price signals quality most where the buyer cannot check the quality before paying
All of the evidence points at one rule. The price does the talking when nothing else can, and it goes quiet as soon as the buyer can look for themselves.
- A free trial hands the buyer the answer, so the price stops carrying information about quality.
- Published specifications and independent reviews also hand the buyer the answer, which is why electronics is the weakest category for the price to quality effect.
- Taste, pain relief, legal advice and status cannot be checked before paying, which is why those are the strongest categories.
- A repeat buyer has already checked, which is why the price to quality effect is weakest on the customers you already have.
| Business type | How much a high price does for you | How little the buyer can check before paying | How strong the evidence is here | What a price rise risks |
|---|---|---|---|---|
| Free app with in-app purchases | Little, the buyer has already used it for free | Nothing is hidden, they have the whole product in their hand | Medium, no app-specific study exists but the effect is weakest on familiar users | Fewer people cross the paywall, though the free users stay |
| Paid app with no free trial | Some, the screenshots, reviews and icon are all the buyer gets | Reviews and screenshots are available, the product itself is not | Medium, no app-specific study exists | Fewer downloads, and store ranking follows downloads |
| Business software sold on a sales call | Some, and a price that looks too low can read as risky to a buying committee | Almost nothing until the software is installed and running | Medium, the meta-analysis found the effect weaker for services than for goods | Longer sales cycles and more people who have to approve |
| Luxury goods and fashion | A lot, the price is part of what the buyer is buying | Little, quality claims cannot be tested and the label carries the value | Strong, eight experiments confirmed demand can rise with price here | Little, this is the one category where demand can rise with price |
| Cars | Some, most buyers never read the reliability data that exists | Test drives and public reliability rankings are both available | Strong, Consumer Reports ranks 19 brands every year | A lot, buyers compare directly and Mercedes ranks last on reliability |
| Consumer electronics and hardware | Little, specifications and independent test scores are published | Nothing, every number is on the box and in the reviews | Strong, 65 years of laboratory tests cover this category directly | A lot, buyers line up the specifications side by side |
| Wine, food and drink | A lot, taste cannot be checked before the money is spent | Nothing, the product has to be consumed to be judged | Strong, the wine scanner study and the energy drink study are both here | Repeat buyers learn what it tastes like and stop reading the price |
| Professional services like lawyers and consultants | A lot, a cheap adviser reads as a worse adviser | Nothing, you cannot judge the advice until you have paid for it | Weak, no field test exists and the meta-analysis found services weaker | Clients ask for more proof, references and fixed quotes |
| Supplements and pain relief | A lot, and the expectation itself changes the reported result | Nothing, the effect is invisible and partly created by expectation | Strong, the JAMA placebo experiment tested exactly this | Regulators watch health claims, so the price has to carry the message alone |
An app sits in the weak half of that table, and a free app sits at the very bottom of it.

A Veblen good sells more as it gets dearer, and almost nothing is a Veblen good
The strongest form of the price to quality claim is that raising the price raises demand. That does happen, and the conditions are narrow.
- A Veblen good is a product that sells more units as the price goes up, which is the reverse of ordinary demand.
- Thorstein Veblen named the behaviour conspicuous consumption in 1899, meaning spending done so that other people can see it.
- A 2021 analysis using eight experiments found the effect is real, and that it varies between hard luxury like watches and jewellery and soft luxury like clothing and leather.
- Whether the Veblen effect appears at all depends on whether the buyer is buying for themselves or buying to be seen.
- The Veblen effect needs other people to be able to see what was paid, which a watch satisfies and an app on a phone does not.
If nobody can see your price except the person paying it, do not price as though the Veblen effect is available to you.

Raising your price 1% raises profit 11%, more than three times what selling 1% more does
The reason pricing gets so much attention is one survey published in 1992 and quoted ever since.
- McKinsey surveyed 2,483 companies for a Harvard Business Review article by Marn and Rosiello.
- A 1% rise in price raised operating profit by 11.1%.
- A 1% cut in the cost of making each unit raised operating profit by 7.8%.
- A 1% rise in the number of units sold raised operating profit by 3.3%.
- A 1% cut in fixed costs raised operating profit by 2.3%.
- Price beats volume for arithmetic reasons, because a price rise adds money with no extra cost attached while an extra sale brings its own cost with it.
The catch is that the 11.1% assumes you lose no customers at all, and a price rise always loses somebody.

Work out how many buyers you can lose before a price rise costs you money
There is one formula worth memorising, and it settles most pricing arguments in about ten seconds.
- The share of buyers you can lose and still make the same profit is the price rise divided by the price rise plus your gross margin. Gross margin is what is left of each sale after the cost of delivering that one sale.
- A paid app on the App Store keeps 70% after Apple's 30% commission, so a 20% price rise can lose 20 divided by 90, which is 22% of its buyers, and break even.
- The same app raising its price 50% can lose 42% of its buyers and break even.
- A shop with a 25% gross margin raising prices 10% can lose 29% of its customers and break even, which is more than the app. Low margin businesses gain the most from a price rise.
- The same formula run backwards shows that a 10% discount on a 25% gross margin needs 67% more sales just to break even. That is why discounting is far more dangerous than raising prices.
- Across 1,851 measurements from 81 studies the average price rise of 1% cost 2.62% of the units sold. Those measurements come mostly from supermarket brands with near-identical rivals on the same shelf, which is the harshest case there is.

Ask the four Van Westendorp questions, one of which asks when your price looks too cheap
The Dutch economist Peter van Westendorp published a four-question survey in 1976, and it is still the cheapest way to find a price range.
- Question one asks at what price the product would be so expensive that the buyer would not consider it.
- Question two asks at what price the product starts to feel expensive, so that the buyer would have to think about it.
- Question three asks at what price the product would be a bargain.
- Question four asks at what price the product would be so cheap that the buyer would doubt the quality. That question measures the exact effect this article is about, on your own product, with your own buyers.
- Plot all four answers as running totals against price and the lines cross, and the crossing points mark the range of prices buyers accept.
- The Van Westendorp survey records what people say rather than what they pay, so treat the range it gives you as the starting point for a real test.
If your current price sits below the answer to question four, you are being read as cheap rather than as good value.
Use Camera to Clipboard to move your price test results into one sheet
A price test produces numbers on a dashboard, on another phone, and on paper where somebody wrote the survey answers down, and comparing them means getting all of it onto one screen. Camera to Clipboard, one of my own apps, puts a phone photo straight into your computer's clipboard, so a screen full of results goes into your spreadsheet in one paste.
- A photo of a paper survey sheet lands in the computer clipboard within seconds, ready to paste next to the figures it belongs with.
- Batch mode sends a whole set of photos at once, which suits a week of daily result screens.
- Every photo is also saved into a Camera-to-Clipboard folder in Downloads, so a record survives after the clipboard has moved on. A price test only pays off if you can still find the before figures when the after figures arrive.

Test the price for real in the App Store or Play Console, because opinions are not sales
A survey tells you what somebody says. A price test tells you what they pay, and the two often disagree.
- Google Play Console has built-in price experiments that split real buyers between two prices and report revenue, orders, buyers and average revenue per paying customer. Once a result is clear enough to trust, you apply the winning price across every market.
- Apple lets you set prices by country and by date, so a before-and-after comparison across matched periods works even without a built-in testing tool.
- Judge the result on revenue per visitor and never on the share of visitors who buy, because a price rise is supposed to lower the share who buy.
- Change one thing at a time, because a price change shipped alongside a new feature tells you nothing about either.
- Wait for enough sales, because a test that produced 30 purchases cannot tell $9 from $12.
- Leave existing customers on their old price, so a test does not push away the people already paying you.
Every way of setting a price has a cost and a blind spot. These are the six in common use.
| How you set the price | What it costs you | How fast you get an answer | How much you can trust it | What it misses |
|---|---|---|---|---|
| Add a markup to your costs | Nothing, you already know your costs | An hour | Low, no buyer was consulted at any point | Everything about what anyone would actually pay |
| Copy your closest competitor | Nothing beyond an afternoon of looking | A day | Medium, at least a real market set that number | Their costs, their scale and their pricing mistakes |
| Van Westendorp four-question survey | The cost of reaching enough real potential buyers | A week or two | Medium, it records what people say rather than what they pay | The gap between a stated price and a paid one |
| Interviews about what people would pay | Your own hours, one buyer at a time | Several weeks | Medium, richer than a survey and still only words | Anyone who would never agree to be interviewed |
| Live price test in the store | Some lost sales on the losing price while the test runs | As long as it takes to collect enough purchases | High, it is measured in money that changed hands | Very little, though it only tests the prices you chose to try |
| Raise the price until buyers object | Nothing except the objections | Months of small steps | High, the complaints are real and so are the sales | The best price, because it only ever finds the highest number people will tolerate |

The $9.99 trick lifts sales slightly and does nothing for how good the product looks
The best known pricing tip in the world has now been pooled and measured, and it survives in a much smaller form than its reputation.
- Troll and colleagues pooled 69 studies, 362 measurements and 40,541 participants in 2024, and registered the analysis before running it.
- Prices ending just below a round number, like $9.99, raised the chance of a purchase by a small amount, an effect size of 0.13.
- Just-below prices improved the impression that a shop is cheap, which the authors call a price image.
- Just-below prices had no effect at all on how good people thought the product was.
- After correcting for publication bias, the just-below price effects shrank to close to zero. Publication bias is the habit of studies that found nothing never getting published.
- The strongest single real-world result is still a clothing catalogue test where the same dress sold 16 units at $34, 21 units at $39 and 17 units at $44. Raising the price by $5 raised sales by 31%.
A higher price sold more of the same dress in that catalogue, which is the price to quality effect at work rather than a trick about the digit nine.

Raise your price when nobody has ever told you it is too expensive
These are the working rules that follow from the evidence, in the order you would use them.
- If no potential buyer has ever objected to your price, the price is too low. A number that offends nobody is a number you could have set higher.
- Raise the price for new buyers only and leave existing customers where they are.
- Ship something the buyer can see in the same week you raise the price, so the number has a reason attached to it.
- Test a rise of 20% to 30% rather than 5%, because a 5% change is too small to measure against normal week-to-week noise.
- Expect the share of visitors who buy to fall, and watch revenue per visitor instead.
- Stop raising when refunds and cancellations climb, because that is the product failing to match the price the buyer paid.
- Never cut the price to fix weak sales, because a 10% discount on a 25% gross margin needs 67% more sales just to break even.
- Put the effort into the product for repeat customers, because the price stopped signalling anything to them the moment they used it.
Conclusion: does a higher price make people think a product is better
Yes before the purchase, and not after it. Every number below comes from a study named earlier on this page.
- The habit has a name, the price-quality heuristic, and setting a high price to trigger it is called prestige pricing.
- Price accounted for about 12% of how people rated quality across 54 pooled experiments.
- A higher price raised expected quality in all six of six studies covering 2,842 people.
- Those same six studies found no consistent effect on quality once people had actually used the product.
- A $2.50 placebo pill produced pain relief in 85% of people against 61% for the identical $0.10 pill.
- A discounted energy drink left students solving 7.7 puzzles against 9.5 at full price, and 9.1 for drinking nothing.
- Across 65 years of independent tests, measured quality explains about 4% of the price gap between rival brands.
- Toyota ranked first for reliability and Mercedes ranked last of 19 brands.
- The price to quality effect is strongest where the buyer cannot check quality first, so wine, medicine, legal advice and luxury goods.
- The price to quality effect is weakest for services, durable goods, and customers who already know your product.
- A Veblen good sells more as the price rises, and it needs other people to see what was paid.
- A 1% price rise raised operating profit 11.1% across 2,483 companies.
- You can lose the price rise divided by the price rise plus your gross margin, and still make the same profit.
- A 20% rise on a 70% gross margin app can lose 22% of its buyers and break even.
- A 10% discount on a 25% gross margin needs 67% more sales to break even.
- Prices ending in 99 raised purchases by a small amount and changed what people thought of the product by nothing.
- Ask the four Van Westendorp questions to find the range, then test inside it with real money.
- Raise your price when nobody has ever told you it is too expensive.