
Every indie developer forum repeats the same number: about $35 in ads to get one paying customer. Usually with an explanation attached, something like "you buy 35 clicks at a dollar each and one of them pays". The number is roughly right. The explanation is wrong. That gap matters: if $35 is a law of physics, most small apps should never open an ad account. If it is a median produced by four multipliers, the real question is how far down you can push it, and what that lets you charge.
The short version:
- This is not an app-only problem. The same four numbers decide the cost of a customer for a SaaS, a web product or a physical good. Only the middle word changes: install, signup or trial.
- $35 is real but median. Benchmarks put one paying app customer at $20 to $80, ecommerce at $68 to $84.
- It is not a price you look up, it is four multipliers: CPM, click rate, signup rate, payer rate. Those four are what this article calls your funnel, the chain from someone seeing the ad to someone paying, with most people dropping out at every step. Same platform, same week, they produce $11 to $833.
- Distrust any platform's "CPA". Apple's quoted $2.51 to $3.76 is a cost per install, not per customer. Divide it by your payer rate, or you understate your real cost by 10x.
- Practical floor: about $10 to $15 on paid social, $13 to $25 on Apple search. Much closer to $35 than the headline numbers suggest.
- Biggest lever is creative, not the bid. The top 10% pay 40% to 60% less per install.
- At the 2% to 5% payer rate freemium apps really have, that same median funnel costs $120, not $35.
- The sting: the median subscription app earns $21.37 per payer in year one. A $35 CAC loses money on every customer bought.
- So the output of all this is not an ad budget. It is a price floor.

The $35 customer is a real median, not an invention
The number is not folklore. Independently published 2025 and 2026 benchmark sets land in the same band.
| Where the number comes from | Cost of one customer | How reliable it is | What it tells you |
|---|---|---|---|
| Mobile apps, per paying user | $20 to $80 | Directly comparable | $35 sits almost exactly mid-band |
| Meta, measured cost per purchase | $41.94 to $48.18 | Observed transactions, not modelled | The strongest single data point here |
| Ecommerce average | $68 to $84 | Broad, up 60% in five years | Physical goods cost more to sell |
| Google Ads, per conversion | $48.96 search, $75.51 display | Loose: a conversion is often a lead | True cost per payer is higher still |
| B2B SaaS | $200 to $2,000 | Well documented | Proves $35 is not a constant: CAC tracks price |
So the rumour survives contact with the data. The explanation attached to it does not.
The 35 clicks at a dollar story is arithmetically backwards
- Nobody pays a dollar a click. Meta's 2025 average CPC was about $0.30. So $35 buys roughly 115 clicks, not 35.
- Clicks are not what fails. Meta's median ecommerce conversion was 1.57% of clicks, and RevenueCat found install-to-trial at just 3.7%, the single largest drop-out in the whole journey.
- So the auction is rarely your problem. Believe the clicks story and you will spend your life on bids. The leverage is elsewhere.
The $35 is real. The story explaining it points you at the one stage of the funnel where you have the least control and the least to gain.

Cost per customer is four multipliers, not a price you look up
You buy impressions. A fraction click. A fraction of those sign up. A fraction of those pay. That is the entire model.
| Stage | What it measures | Median value | Who controls it |
|---|---|---|---|
| 1. CPM | Price of 1,000 impressions | $13.48 | The auction, barely you |
| 2. Click-through rate | Impressions that become clicks | 1.5% | Your creative |
| 3. Click to signup | Clicks that install or register | 30% | Your store or landing page |
| 4. Payer rate | Signups that actually pay | 8%, but freemium runs 2% to 5% | Your paywall, entirely |
Run those medians through the chain and the rumour reproduces itself:
$13.48 buys 1,000 impressions (2025 Meta median CPM)1,000
At a 1.5% CTR, those impressions become clicks, at $0.90 each15
At a 30% store or landing page conversion, clicks become installs, at $3.00 each4.5
At an 8% install-to-payer rate, installs become paying customers0.36
Cost of one paying customer$37.44
Four public median numbers, multiplied. Three things follow:
- $35 is the price of an average funnel, not of a customer. It tells you what is typical, nothing about what is achievable.
- Cost per customer is just cost per install divided by your payer rate. At 20% that is 5x. At 8%, 12.5x. At 3%, 33x. Which is why "4 to 5 times CPI" and "20 to 50 times CPI" are both true, for different apps.
- Improving all four funnel stages by 40% cuts cost per customer by 74%, not 40%. Improve all four by 40% and cost falls 74%, not 40%. This is why the gap between good and bad advertisers is so much wider than people expect.
- Notice what stage 4 had to be to land on $35. Reproducing the rumour needs about an 8% payer rate, well above the 2% to 5% a freemium app really converts. The famous number already assumes a hard paywall, meaning you have to pay before you can really use the thing. Hold that thought, it returns later and it changes the answer.
Use Repeat Recorder to practise the opening of a video ad
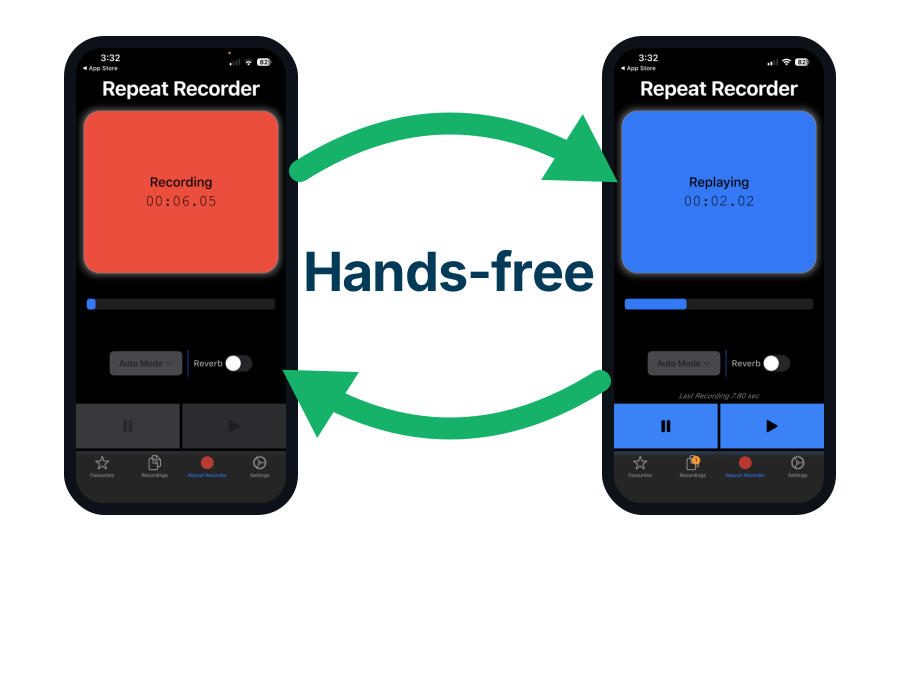
Four numbers multiplied together produce the price of a customer, and the second of them is the share of people who click after seeing the ad. On a video ad that share is mostly decided by the talking in the first few seconds, which is the cheapest thing on the list to change and the one nobody rehearses. Repeat Recorder, one of my own apps, records you and plays the take straight back without you touching the phone.
- Repeat Recorder plays each take back automatically and then starts recording again, so the same opening line can be run twenty times hands-free. That loop is the whole app. It was built for people drilling a phrase in a new language, and rehearsing an advert is the same job with different words.
- Improving all four funnel stages by 40% cuts the cost of a paying customer by 74%, so the click rate earns its keep even when it only moves a little. The medians in the chain above are a 1.5% click rate and $0.90 a click, and the talking at the start of a video is one of the few things in that chain you can change this afternoon for nothing.
- Takes worth keeping go into favourites and into folders you name yourself, so two versions of the same opening line sit next to each other. Recording a line twice and picking the one that sounds less stiff costs about a minute, against the $13.48 it costs to put a thousand impressions behind the wrong one.

The cheapest click is almost never the cheapest customer
Two things decide whether a channel is any use: what a customer costs there, and whether you can keep buying more of them. The last column is the one people forget, and it is why the cheapest channel is rarely the one you can build on.
| Channel | Cost per click or tap | Cost per install or signup | Typical cost to obtain a paying customer | Intent of the person you reach | If you double your budget, do you get twice the customers? |
|---|---|---|---|---|---|
| Apple Ads (App Store search) | $2.25 per tap | $2.51 to $3.76 | $13 to $25 | Highest. They typed your category into the store | No. Only so many people search your keywords. The extra budget goes unspent |
| Google App Campaigns, Android | Low. Google picks the bid | $1.92 | $24 | Mixed. Search, Play, YouTube and banners at once | Mostly yes. Four places to show the ad, so it rarely runs out of room |
| Google App Campaigns, iOS | Low. Google picks the bid | $5.84, 3x the Android price | $73 against Android's $24 | Mixed. The same four places | Mostly, but blind. Apple's privacy rules delay your results by 1 to 3 days |
| Meta (Facebook and Instagram) | $0.30 per click | $2.09 and up | $42 to $48 | Low. You interrupted them | Mostly yes. Plenty of ad slots, and a test answers in days |
| TikTok | Low. The cheapest feed there is | $1.00 to $3.00 | $13 to $60 | Lowest. They came to be entertained | For a while. Each video dies within days, so you need new ones constantly |
| Google Search (web, not app) | $1.60 to $8.58 by industry | Varies with your landing page | $49 | Very high. They typed the problem into Google | Partly. Capped by how many people search. You can only buy a bigger share |
| Google Display | Very low | High. Only 0.07% of banners get clicked, so it takes a great many of them | $76 | Lowest. Nobody looks at banners | Yes, endlessly. Always another banner slot. That is why it is cheap and converts badly |
| Meta retargeting (people who visited your site) | $0.50 to $1.20. Dearer than Meta's $0.30 cold click | 3x cheaper than cold Meta | $80. Meta will claim $22 | High. They visited you before | No. The list is last month's visitors. More money just repeats the same ad |
| Google Display retargeting (banners that follow you) | Very low | Better than cold display, but blocked cookies delete most of the list | $138. Google will claim $38 | Medium. They visited, but not today | No. You can only reach people already on your list |
| Google Search retargeting (bid more when a past visitor searches) | Higher. You bid up for these people on purpose | Best of the three | $95. Google will claim $26 | Highest. Searching now, and they know you | No. They must visit you and then search. Two limits at once |
| App Store Optimisation (organic) | Free | Free | $0. You pay in time | Highest. The same people as Apple Ads | No. Money buys none of it. 400 a month stays 400 |
| Referral programme (users invite friends for a reward) | Free | $0.50 to $2.00 | $25 to $65, reward included | Highest. A friend recommended you | No. It is a share of your users, so it grows only when you do |
The cheapest customers come from the channels you cannot buy more of. The paid feeds cost more precisely because spending more actually works there.
- Retargeting's cheap price is not real. Meta says a customer costs $22. Only about a quarter of those people needed the ad, the rest were buying anyway, so the real price is nearly four times higher: $80. On Google Display it is $138. Both cost more than advertising to strangers. Full working here.
- Only the retargeting rows are corrected for over-reporting, because only they need it. Only the retargeting rows have been corrected this way, because they are the only ones anyone has tested properly. For retargeting to catch up, Meta and Google would have to be overstating their other numbers by half as well, and they are not, because retargeting is flattered by aiming at people who are already trying to buy and ordinary advertising is not.
- iOS costs 3x Android, and the gap survives all the way to the customer. An install costs $5.84 against $1.92, and a paying customer $73 against $24. People buy iOS anyway because iPhone users spend more, but that is an argument you have to win with your own revenue figures, not with the install price. Nothing here makes an iOS customer cheap.
- Your budget is a ceiling, not an accelerator. It caps what you spend. It cannot create demand. When a channel runs out of people, the money sits there unspent.
- Your bid is the price, and it is a separate control. To get more out of a fixed pool of searches you outbid rivals for a bigger share, which costs more per result. That is what makes a channel expensive, not the budget.
- Automated bidding hides the difference. Raise the budget and the system bids harder to spend it, so cost per result climbs and the budget looks guilty. The bid did it.
The single most misread number in this entire subject
When an ad platform says "CPA", it almost never means a paying customer. Apple's own reporting defines CPA as spend divided by installs. So the widely quoted Apple Ads figure of $2.51 to $3.76 is a cost per download, not a cost per customer. The arithmetic confirms it: a $2.25 cost per tap at a 67.2% tap-to-install rate is $3.35 per install, right inside that band.
Quote it as a customer cost and you understate your real cost by 10x or more. A $3.35 install only becomes a customer at your payer rate: 20x at 5%, 12.5x at 8%, 6.7x at 15%. Google counts "conversions" that are frequently just leads, and Meta's cost per purchase is one of the few published figures that genuinely is a payment.
So there is only one honest way to read the table above. The install column is measured. The customer column is that install cost divided by a payer rate, so every figure in it carries an assumption about how many of your signups pay, and yours will not be the median. Meta's cost per purchase and the three retargeting rows are the exceptions: those are payments, not installs.
What separates channels is whether the person is looking now
Two different things get muddled together here, and keeping them apart explains most of the price differences in the table. Familiarity is whether they have heard of you. Intent is whether they want this thing at this moment. They are not the same axis, and only one of them predicts cost.
| Where the ad appears | Have they heard of you? | Are they looking for it right now? | Typical cost to obtain a paying customer |
|---|---|---|---|
| Apple Ads, App Store search | No, completely cold | Yes, they typed your category into the store | $13 to $25 |
| Google Search | No, completely cold | Yes, they described the problem in the search box | About $49 |
| Meta and TikTok feeds | No, completely cold | No, you interrupted them mid-scroll | $13 to $60 |
| Google Display banners | No, completely cold | No, and often not really looking at the page either | About $76 |
| Retargeting, on any of the above | Yes, warm, they visited you before | Sometimes, you are reminding rather than introducing | Meta and Google will say $22 to $38. The truth is $80 to $138 |
- Four of the five channels here reach people who have never heard of you. Four of the five rows are people who have never heard of you. Familiarity barely varies, so it cannot be what explains a six-fold price range.
- Apple Ads costs $13 to $25 because somebody typed your category into a store. Apple Ads, where someone typed your category into a store, runs $13 to $25. Display banners, where nobody is looking for anything, run about $76. That is up to 6x between two rows of equally cold strangers.
- Apple Ads is the proof that the two axes are different. Those users are completely cold, they have never heard of your app, and it is still among the cheapest channels there is, purely because they are searching.
- Retargeting is the only genuinely warm option, and it is also the dearest row here. It converts at 3.8% against 1.5% for cold traffic, which is why it looks cheap, and it is capped by visitors you already paid for elsewhere.
- That cheap retargeting number is also the least trustworthy one in the table. It is only what Meta and Google claim. Only about a quarter of those sales needed the ad, so the same money buys you a quarter as many real customers, which puts the real figure at $80 to $138, above every cold row in this table. There is a whole separate article on retargeting covering how it works, why it is not worth funding, and why you should install the tag anyway.

Eight things move your cost per customer, and the bid is weakest
If the auction set the price, the spread between advertisers would be narrow. It is not. Here is what actually moves it.
| Lever | How much it moves cost per customer | Evidence | How hard it is to do | How soon you see the result |
|---|---|---|---|---|
| Where you put the paywall (pay first, or use free and pay later) | Up 8x on revenue per install, which is the same thing as cutting cost per customer to an eighth | Strong: hard-paywall apps earned $3.09 per install at day 60 against $0.38 for freemium | Low, it is a product decision, not a spend decision | Immediate, visible within a week |
| Creative quality and volume of tests | Down 40% to 60% per install for the best 10% of advertisers | Strong: top 10% of advertisers ship 5x more creative variants per week | High, it is a permanent production process | Weeks, you need volume of tests before signal |
| Which country you advertise in | Down 14x on what an ad costs, down 90x on what a download pays its developer. Roughly 6x worse off | Strong, and the plainest number in this article. Add up everything people in a country spend in the app stores, divide by the downloads they made, and each Indian download works out at about $0.05 against $4.60 in the US. India downloads more apps than any country on earth, 25.5 billion in 2025, and does not appear in the top 20 markets for consumer spending | Very easy. It is one setting in the ad account | The cheaper cost shows up straight away. The missing revenue takes months to notice |
| Advertising to past visitors instead of strangers (retargeting) | Up about 2x. Meta reports $22 against $42 to $48 for a stranger, but a real customer costs $80 | Strong, and it runs the wrong way: retargeting converts at 3.8% against 1.5% cold, but a holdout finds the ads caused only 27.5% of the sales credited to them | Low, and it needs traffic you have already paid for | Months, because the reported figure is wrong until you run a holdout |
| Channel intent (search vs feed) | Down roughly 10x at the install stage | Medium: Apple Ads convert 67.2% of taps to installs, feeds convert far less | Medium, needs different creative and keyword work | Fast, search campaigns stabilise quickly |
| Trial length and structure | Up about 1.7x on the share of trials that pay | Real but not a straight line: 17 to 32 day trials convert at 42.5% against 25.5% under 4 days, but 5 to 9 days wins in several categories and long trials delay your money | Trivial, it is a configuration value | Slow, you must wait out the trial to measure |
| Bid strategy, keywords and audience settings | Under 2x either way, and usually far less | Medium: the ad itself now explains more of the price difference between advertisers than any targeting setting does | Medium, and it eats far more time than it deserves | Immediate |
| Seasonality and when you run | Up 1.3x to 1.6x in the October to December run-up | Strong: CPMs rise 30% to 60% from October to December | Trivial, it is a calendar decision | Immediate |
The ordering is uncomfortable, because what people spend the most time on sits near the bottom:
- Creative is a production problem, not a taste problem. The top 10% of advertisers ship 5x more versions of their ads every week. The winning ad is found, not designed.
- The paywall beats the ad account. An 8x swing in revenue per install, larger than anything available inside the platform, and free to change.
- Since Apple and Google cut tracking, the ad itself explains more than the targeting. Since Apple and Google cut off most tracking data, the ad itself explains more of the price difference between advertisers than any targeting setting does.
- Moving the paywall costs nothing and shows up within a week. Moving the paywall is a product decision, costs nothing and shows up within a week. Only making ads in volume is expensive, and only that keeps paying off over time.
- Two of these look like savings and are losses. Advertising in a cheap country makes a download 14x cheaper to buy, but people there spend about 90x less in the app stores. Retargeting reports $22 a customer and really costs $80. Both are covered below.
Why the CPMs here are not the $3 you may have seen quoted
A CPM is the price of a thousand impressions, not one. The $13.48 Meta median is about 1.3 cents to put your ad in front of one person. Cheap per head; it only sounds large because it is quoted per thousand.
And the platform decides almost everything. The number swings roughly 7x, so a CPM quoted without its source means nothing:
- Display and TikTok are the cheapest, $2.80 to $3.50 per thousand impressions. $2.80 programmatic display, $3.12 Google Display, $3.50 TikTok.
- Meta costs about five times more, $13.48 per thousand impressions worldwide. $14.19 across all industries, and $16 to $23 in the US.
- Campaign type alone doubles it. Meta reach campaigns clear near $7.19, conversion campaigns $14.68, because you are bidding against everyone else who wants buyers rather than eyeballs.
So why does this article model Meta at $13.48 rather than display at $3.12? Because the cheap impression is cheap for a reason. Google Display clicks at 0.07% and costs $75.51 per conversion, against Meta's $41.94 to $48.18 per measured purchase. A quarter of the impression price for double the cost per customer is not a saving. Nobody ever went bust buying expensive impressions. They go bust buying cheap ones.

CPM sets a hard floor of about $11 in a rich country
Every paid customer starts as an impression, and impressions are auctioned against other bidders. You cannot pay less than the next advertiser is willing to pay. So the lowest possible cost per customer is the cheapest impressions you can buy, divided by the best you can realistically do at every stage after that. Here is the ninetieth percentile of each, in a rich country:
$8.00 buys 1,000 impressions (a strong ad earns a discount below the $13.48 median, because platforms charge less for ads people actually engage with)1,000
At a 2.0% CTR, well above the platform average, at $0.40 per click20
At a 30% store page conversion, at $1.33 per install6.0
At a 12% install-to-payer rate, which requires a hard paywall0.72
Cost of one paying customer$11.11
Sanity-check any funnel you build this way against published install costs
It is easy to stack four optimistic assumptions and produce a floor that cannot exist. A 3% click-through rate combined with a 45% store conversion implies a $0.59 cost per install, and no benchmark from a rich country supports that: North American installs cost $2.50 to $5.28, and even the best 10% of advertisers only get 40% to 60% below the median.
Check the third row of your chain before you trust the fourth. The $1.33 install above is already aggressive. Anything under a dollar in a rich country means you are buying the cheapest throwaway-game ad slots there are, or you have made an arithmetic mistake.
That is the answer to the original question, and it is worth stating plainly:
$10 to $15 is the least you can realistically pay for one paying customer on Facebook or Instagram in a rich country like the US, UK or Australia. Even that needs you in the top 10% at four separate stages at once. On Apple's search ads it works out at $13 to $25. The $2.51 to $3.76 Apple publishes is the price of a download, and you still have to divide it by the share of people who go on to pay. No measured data anywhere shows a paying customer bought for less than about $12.
| Market | Meta CPM | What that does to your cost per customer | What it does to revenue per customer | Whether the swap is actually worth making |
|---|---|---|---|---|
| United States | $16.08 to $23.00 | Highest, the benchmark case | Highest willingness and ability to pay | Neutral, expensive but the money is there |
| Canada | $14.03 | Slightly lower | High, close to US behaviour | Often favourable, a common first test market |
| Australia | $11.04 | Moderately lower | High, strong subscription adoption | Often favourable |
| United Kingdom | $10.85 | Moderately lower | High | Often favourable |
| Latin America (broad) | Low, installs land at $0.50 to $2.00 | Lower, but only once you discount the price | Much lower average revenue per user | Roughly a wash unless you price locally |
| India | $1.36 | Lowest, ads are 14x cheaper than the US | Lowest, about $0.05 a download, and card-based subscription friction is high | Usually a loss for a paid app: ads 14x cheaper, revenue about 90x lower |
| Nigeria | $1.50 | Almost as low as India | Lowest | Usually a loss for a paid app, for the same reason as India |
Why cheap countries do not work, in one comparison
The ads get 14x cheaper. The customers spend about 90x less. That is the whole thing. Reaching a thousand people costs $16 to $23 in the US and $1.36 in India. But take everything people in each country spent in the app stores last year, divide it by how many apps they downloaded, and one download works out at about $4.60 in the US against $0.05 in India. That is money going to developers, all of them together, not to you specifically, and it is the clearest measure there is of whether a country pays for apps at all. No bid strategy closes a gap that size.
India is the world's largest app market by downloads and does not make the top 20 by consumer spending. 25.5 billion downloads in 2025 against America's 12.6 billion. Those users are real, engaged and enormous in number, and they monetise through advertising rather than paying for apps.
It is changing, from a very low base. Indian consumer spending hit a record $345 million in a quarter, up 35% year on year, the fastest growth of any major market, and the amount an Indian download puts into a developer's pocket has more than doubled in three and a half years. Worth watching. Not worth pointing a subscription app at yet, unless you price for the local market and plan for a fraction of the revenue per customer.
Use Camera to Clipboard to move store screenshots off your phone
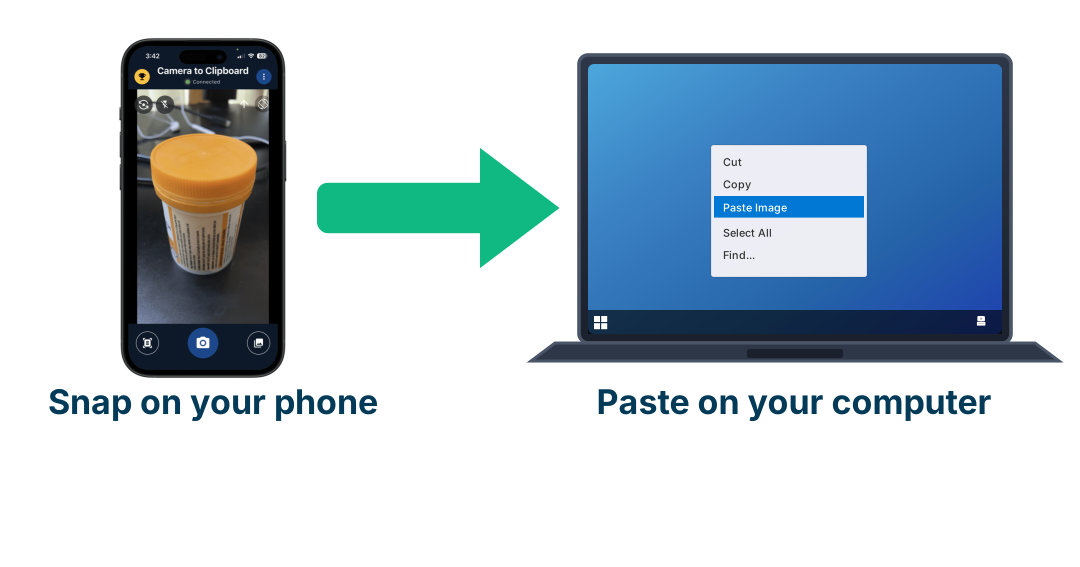
No bid strategy closes a 90x gap in what a download is worth, which leaves the stages of the chain you actually control, and the store listing is the stage that turns a click into an install. That listing is a set of pictures, and if the product is a phone app every one of them starts on a phone. Camera to Clipboard, one of my own apps, puts a picture from the phone onto the computer clipboard straight away.
- Screenshots already sitting in the phone’s library can be sent to the computer several at a time, so a whole set arrives in one go. There is no emailing them to yourself, no cable and no upload to somebody else’s website in between. The phone and the computer find each other over your own local network and send the pictures directly.
- The store page turns about 30% of clicks into installs in the chain on this page, and it is a page made of pictures. Improving all four stages by 40% cuts the cost of a paying customer by 74%, and of those four the screenshots are the cheapest to redo, because redoing them costs an afternoon rather than an ad budget.
- A picture from Camera to Clipboard arrives as an ordinary clipboard image, so Photoshop and GIMP open it as a new layer and Word and Google Docs take it inline. Anything that accepts a pasted picture accepts this one, which matters when the same screenshot has to be resized once for the App Store and again for Google Play.

The same $1,000 buys 90 customers or 1.2 customers
Same platform, same country, same budget, same week. The only thing changing between these rows is how well the advertiser does their job.
| Funnel | CPM paid | Click-through rate | Click to install or signup | Install or signup to paying | Cost to obtain a paying customer | Customers per $1,000 |
|---|---|---|---|---|---|---|
| Top 10% at every stage | $8.00 | 2.0% | 30% | 12% | $11.11 | 90 |
| Above average at every stage | $11.00 | 2.0% | 30% | 8% | $22.92 | 44 |
| Average at every stage: the $35 rumour | $13.48 | 1.5% | 30% | 8% | $37.44 | 27 |
| Average, but only 2.5% of signups pay | $13.48 | 1.5% | 30% | 2.5% | $119.82 | 8 |
| Below average at every stage | $20.00 | 0.8% | 20% | 1.5% | $833.33 | 1.2 |
A 75x spread, from four numbers, none of which is the bid.
- Every row here is buying the same country, and the CPM still runs from $8 to $20. That is not geography, it is ad quality. Meta charges you less to show an ad people stop and engage with, and more to show one they scroll straight past, because a good ad keeps people in the feed. So a bad ad pays a higher price to reach the exact same person.
- Row four is the uncomfortable one, and it is the honest reading of the $35 rumour. Identical ad buying, payer rate dropped from 8% to the 2% to 5% that freemium apps actually run, and the cost triples to $119.82. The famous benchmark quietly assumes a hard paywall, where you pay before you can use it, which most products do not have.
- So "$35 per customer" describes a filtered population. Products that make you pay before you get much use out of them. A pure freemium app at a 2.5% payer rate is not paying $35, it is paying north of $100 and often does not know it.
- Median to strong is only CPM and CTR, $13.48 to $11.00 and 1.5% to 2.0%. Nothing heroic, and it takes $37 to $23.
- The share of users who pay moves cost per customer more than any ad setting. It is also the stage furthest from the ad platform and closest to your product.
- "Do ads work" is not a well-formed question. Every row pays into the same auction. Asking whether advertising works is like asking whether cooking works.
You do not lower cost per customer by buying better. You lower it by being a business that converts, and then buying.

The cheapest customers cost time instead of money
With ads there is always another advertiser bidding against you, and that is what sets the price. Nobody bids against you for a good app store listing, or for one friend telling another. Nothing sets a price at all, which is why the cheapest customers most businesses ever get do not come from advertising.
| Channel | Cost to obtain a paying customer | Why it is cheap | What stops you simply getting more | Does it keep working after you stop? |
|---|---|---|---|---|
| Referral programme (you reward users for inviting friends) | $25 to $65, reward included | Your existing users do the persuading for free, and you only hand over the reward when it actually worked | The size of your user base, and the fact that only a small share of people ever invite anyone | Yes, it grows as you grow |
| Plain word of mouth (no programme, no reward) | Nothing at all | Someone simply tells a friend because the product was worth mentioning | You cannot act on it directly: it follows from the product being good, not from any campaign | Yes, and it is the most durable of the lot |
| App Store Optimisation | Nothing in cash. You pay in time: the keywords, the title, the screenshots, the reviews | Reaches the same searching people as Apple Ads, and you are not charged per tap | Search volume for your terms | Slowly, and rankings can be lost |
| Content and SEO | Your time rather than money | An article that ranks keeps bringing people in after you stop writing | How fast you can publish | Strongly, the main reason to do it |
| Forums and community | Your time rather than money | You borrow an audience somebody else spent years building | Your own credibility and hours | Yes, reputation carries forward |
| Citation in AI answers | Your time rather than money | The recommendation arrives already trusted, because a machine gave it rather than an advert | Not directly controllable | Yes, once sources are established |
| Paid ads, for comparison | $11 to $833 | It is not cheap, it is available | Only your budget | No, it stops the day you stop paying |
Everything cheaper than ads is capped by something you cannot buy. If your app store listing brings 400 installs a month, no amount of money makes it 4,000. That reliability is precisely what the higher price of ads buys.
The averaging trap that makes ads look cheaper than they are
Divide your total ad spend by all your new customers, including the free ones who found you through search or a friend, and you get a flattering number. It is always lower than what the ads alone cost, sometimes dramatically.
Right for judging the business, wrong for every advertising decision. It tells you what your average customer cost, never what the next one will cost, and the next one is the only figure that matters when you are deciding whether to spend more. The free customers sitting in that average make ads look efficient right up to the moment you scale and find the next customer costs four times what it implied.
Work out both, and decide on the ads-only one.

A $35 customer has to pay you about $124 to be worth buying
Here the analysis stops being about advertising and becomes about pricing. Work backwards from a CAC and you get a minimum price:
One customer costs you$35.00
At the usual rule that a customer should return 3x what they cost, revenue needed after the store cut$105.00
Add back Apple and Google's 15% cut for small businesses (30% by default)$123.53
Spread over a typical 5-month paying life, the price you must charge$24.71/mo
Almost nothing in the consumer app market is priced at $25 a month. That is the finding: at a $35 CAC, a normally-priced subscription app cannot buy customers profitably. And the benchmark that closes the argument, because it measures outcomes rather than intentions:
$21.37 is all one paying customer pays the average app in a whole year, measured across 115,000 apps. That customer cost $35 to buy. So the average app loses $14 on every customer it buys, before Apple or Google take a cut.
Ask what cost per customer your price actually supports
Turn it around and it becomes a design constraint rather than a verdict. For a given price and retention there is exactly one CAC you can pay.
| What you charge | Gross per customer | Net after the 15% cut | CAC you can afford at 3:1 | When you get your money back |
|---|---|---|---|---|
| $4.99/mo, 5 months | $24.95 | $21.21 | $7.07 | Month 4 or later |
| $9.99/mo, 5 months | $49.95 | $42.46 | $14.15 | Month 4 or later |
| $9.99/mo, 12 months | $119.88 | $101.90 | $33.97 | Month 4 or later |
| $79/year, paid up front | $79.00 | $67.15 | $22.38 | Day one |
| What a $35 CAC actually requires | $123.53 | $105.00 | $35.00 | Depends on the plan |
- A $4.99 app can afford $7.07, not $35. The price was set before anyone checked what it had to buy. This is why cheap apps fail at paid acquisition.
- Annual plans are the cheapest fix available. $79 up front supports a $22.38 CAC and repays on day one, even with 72% first-year churn.
- A $35 CAC needs an annual plan above $120 or a monthly above $20. If neither describes you, the answer is not cheaper ads. It is getting CAC to about $10.
Payback period is the constraint that actually kills small companies
A healthy ratio still leaves you dead if the money returns too slowly, because you fund every customer out of cash you already hold. Healthy payback is under 12 months, elite is 5 to 7, and mobile subscriptions specifically 60 to 90 days.
This is the real argument for annual plans. A $9.99 monthly subscriber takes four months to repay a $35 CAC, and that money cannot buy anyone else meanwhile. An annual plan repays on day one, so the same $1,000 buys customers repeatedly through the year instead of once.
Use Repeat Recorder to practise saying a higher price out loud
A $4.99 app can afford to spend $7.07 winning a customer, and a $35 customer needs an annual plan above $120 or a monthly above $20 behind it, so for most small products the fix is a higher price rather than cheaper advertising. The hard part of a higher price is not the spreadsheet. It is saying the number to a customer, on a call or in a video, without apologising for it. Repeat Recorder, another of my own apps, records you and plays the take straight back without you touching the phone.
- Repeat Recorder plays each take back automatically and then starts recording again, so the same sentence can be said twenty times hands-free. It was built for speech rehearsal, language learning and vocal training. Hearing yourself say “a hundred and twenty dollars a year” half a dozen times is the fastest way to find out whether you believe it.
- An annual plan at $79 paid up front supports a $22.38 cost per customer and repays on day one, even with 72% first-year churn. That is the sentence worth getting right, because the same $1,000 then buys customers repeatedly through the year instead of once.
- Takes worth keeping go into favourites and into folders you name yourself, so the monthly pitch and the annual pitch sit side by side. A $9.99 monthly subscriber takes four months to repay a $35 cost per customer and an annual plan repays immediately, so the two are not the same sentence and should not be practised as one.

Work out your own floor and your minimum price
Set the four multipliers to what you actually measure, or use the presets to jump between the funnels above. Add your price, retention and store cut. It returns the two numbers that matter: what a customer costs, and what you must charge for that to be worth doing.

Getting signups to pay beats every setting in the ad account
In order, for a small independent product:
- 1. Measure the four steps separately, before anything else. What 1,000 people cost to reach, how many clicked, how many signed up, how many paid. One combined number tells you the total is bad and never which step broke it.
- 2. Get more of your signups to pay. Nothing in the ad account comes close. The share of signups who pay you is what turns a signup into a customer: at 8% a customer costs $37, and at the 2.5% most free apps really run, identical ad buying costs $120.
- 3. The biggest thing that moves it is when you ask for money. Apps that make you pay before you can really use the thing earned $3.09 per install by day 60. Apps that let you use it free and hope earned $0.38. That is 8x for about a day of work.
- 4. Test a longer free trial, but do not assume longer is always better. Trials of 17 to 32 days convert at a median 42.5% against 25.5% for trials under four days. The catch is that the relationship is not a straight line: 5 to 9 days is the sweet spot in several categories, 7 days converts best in education and fitness, and a month-long trial means waiting a month to be paid. It is one number on a settings screen, so test it rather than copying anyone.
- 5. Make many ads rather than one good ad. Budget for volume, expect most to fail, switch them off fast. The best 10% pay 40% to 60% less per install, and you cannot tell in advance which of yours those will be.
- 6. Start where people are already searching for what you sell. Apple Ads tells you inside a week whether searchers will actually pay, for hundreds of dollars rather than thousands. It will not scale, and that is fine, because you are buying an answer rather than growth.
- 7. Advertise to strangers after search has told you people will pay, not before. Strangers are where the volume is, and they cost more per customer. That higher price is what volume costs, not a sign you did it wrong.
- 8. Work out the lowest price you can sell at, from what a customer really costs you. Multiply that cost by 3, divide by 0.85 to cover the store's cut, then divide by how many months people stay. If the answer is above what you charge today, you have a pricing problem rather than a marketing one.
- 9. Sell an annual plan before you raise the ad budget. Twelve months of money arrives on day one, so you can afford a dearer customer and you wait no time to get the money back.
- 10. Keep app store listing work and referrals running the whole time. You cannot buy more of them on demand, which is exactly why they have to start early.
The honest bottom line: $35 is a real number, a bad target, and a flattering one. It describes a funnel already converting about 8% of installs to payers; at the 2% to 5% most freemium apps actually run, the same ad buying costs $120. The genuine floor is $10 to $15 on paid social and $13 to $25 on high-intent search, which is much closer to $35 than the platforms' own numbers suggest, because those numbers count installs and call them acquisitions. So there is less room below $35 than you would hope, and that puts the weight on the other side of the equation: the median subscription app earns $21.37 per payer in year one, and no bid strategy fixes that. Advertising can absolutely be made efficient. It cannot rescue a product whose price never had room for a customer in it.
Conclusion: how low the cost of a paying customer can go
- The cost of one paying customer is four numbers multiplied together, not a price you can look up. What 1,000 impressions cost, how many people click, how many of those install or sign up, and how many of those actually pay. A cheaper install is not a cheaper customer until you divide by the share of them who pay.
- A paying customer costs $10 to $15 at best on paid social and $13 to $25 on search ads, and the widely quoted $35 median only holds while about 8% of installs pay. At the 2% to 5% most free apps really run, identical ad buying costs $120 per paying customer, on the same platform, in the same country, in the same week.
- Getting more of your signups to pay beats every setting in the ad account, and asking for money earlier is the single biggest move. Apps that make you pay before you can really use the thing earned $3.09 per install by day 60, against $0.38 for apps that stay free and hope, which is 8x for about a day of work.