
You have ten hours this week. You can point a camera at yourself, talk, and publish the moment you stop talking, three times over. Or you can make one video, script it, light it, cut it properly, and publish that. The subject matter is identical either way. The only thing that changes is how finished it looks. Every large dataset on this points at more videos, and almost every well-known creator says the opposite, and both are right, because they are answering different questions. What follows is the evidence, the arithmetic that settles it, the point past which more videos start costing you subscribers, and the specific hours you are allowed to cut. I make small apps (Repeat Recorder, Paint Vlix, Camera to Clipboard) and film all of it myself with no crew, so this is the exact trade I make every week.
The short version: Post more. Across 10.2 million channels, the ones uploading 12 or more times a month grew views 4.1 times faster than the ones uploading less than once a month, and the median channel posting less than once a month gained zero subscribers. This is not the algorithm rewarding you, and YouTube's own staff say frequency is not a ranking factor. It works because about 10% of videos take 80% of all views, so almost all of a channel's views come from a few hits, meaning videos that do many times your normal views, and every upload is another chance at one. The catch is where the extra hours come from. If a rough video takes 3 hours and a finished one takes 12, the finished one has to be four times likelier to be a hit just to come out equal, and colour grading, b-roll and a second camera angle do not do that. The thumbnail, the title and the first 30 seconds do, and they cost about two hours combined, so cut everything else and never those. Two limits: your subject decides how often you can post (gaming and kids reward 20 to 40 a month, but science, education, health, home and travel peak at 2 to 5 and lose subscribers past it), and 52% of creators report burnout, so the right rate is the fastest one you can keep up for a year.

Post more videos and cut the edit, not the thumbnail
The whole answer, before any of the evidence behind it.
- Channels posting 12 or more videos a month grew views 4.1x faster. Across 10.2 million channels, the ones uploading 12 or more times a month grew views 4.1 times faster than the ones uploading less than once a month, and the growth rate rose at every step in between.
- Find the hours for the extra videos in the edit, never in the thumbnail. Colour grading, b-roll, a second camera angle and retakes until the delivery is perfect are close to free to drop. The thumbnail, the title and the first 30 seconds decide the entire result, and rushing those wastes the video you just made.
- Stop adding videos before your subscribers get tired and before you burn out. Gaming and kids channels reward 20 to 40 uploads a month, but science, education, health, home and travel peak at 2 to 5 and lose subscribers past it. 52% of creators report burnout, so the right rate is the fastest one you can keep up for a year.
So: post more, up to as often as your subject can take, and find those extra hours by editing less rather than by rushing the two minutes that decide whether anybody clicks.

YouTube channels posting 12 a month grow views 4x faster
The largest published sample on this question is vidIQ's study of 10,210,278 channels with at least 1,000 subscribers, tracked from April 2025 to March 2026, counting long-form and Shorts together.
| Uploads a month | Median monthly view growth | Median monthly subscriber growth | Where a year of that lands you |
|---|---|---|---|
| 12 or more | 2.18% the top tier | 0.91% the top tier | Up 29.5% in views, compounded |
| 4 to 7 | 1.32% roughly weekly | 0.39% roughly weekly | Up 17.0% in views, compounded |
| 1 to 3 | 0.89% monthly to fortnightly | 0.10% monthly to fortnightly | Up 11.2% in views, compounded |
| Below 1 | 0.53% the bottom tier | 0.00% no subscribers at all | Up 6.5% in views, compounded |
- Posting less than once a month gains you zero subscribers. That is the median channel in the bottom tier, over a median month. Not few. Zero. Views still creep up because the older videos keep being watched, so the channel seems to be doing fine while the audience has stopped growing entirely.
- Every upload-frequency tier grew faster than the tier below it. All five upload-rate groups, in order, with no exceptions. One gap between the extremes could be a single odd group of channels; five tiers rising in order is a real pattern. The cheapest step is going from 1 to 3 a month up to 4 to 7, which lifts median view growth by half again.
- The upload-frequency study found a pattern, not proof that posting more causes the growth. The authors say so themselves: the study "does not prove that weekly uploads cause growth". Channels that upload a lot also have more time, more money and more commitment, and each of those grows a channel on its own.
Which is why the rest of this is about mechanism. A pattern this large is worth explaining before you obey it.

YouTube says upload frequency is not a ranking factor
This is the part most upload-schedule advice gets backwards, and the people who build the system have said so on the record.
- YouTube's director of growth says upload frequency is not an algorithm factor. Todd Beaupre, YouTube's senior director of growth and discovery: "Upload frequency is not a factor that the YouTube algorithm focuses on." The system ranks a video on how that video performs with the people it gets shown to.
- Spacing uploads days apart achieves nothing, says YouTube's creator liaison. Rene Ritchie, YouTube's creator liaison, on the popular advice to wait a day or two between uploads: waiting 24 to 48 hours "is no different than waiting 24 to 48 seconds or weeks or months". All you are doing is waiting.
- A predictable schedule works on your audience's habits, not on the ranking system. A predictable schedule builds a habit: people come back on the day, they keep checking their subscriptions, they open the notifications. That is your audience behaving like an audience, not the ranking system awarding points for punctuality.
- Swapping the word algorithm for the word audience answers most schedule questions. This is Ritchie's own suggestion and it dissolves most of these arguments. "Does the algorithm reward daily uploads" becomes "does my audience want something from me every day", and for most subjects the answer is obviously no.
So frequency is not a lever on the recommendation system. It is a lever on everything upstream of it, which turns out to be where the growth was hiding.
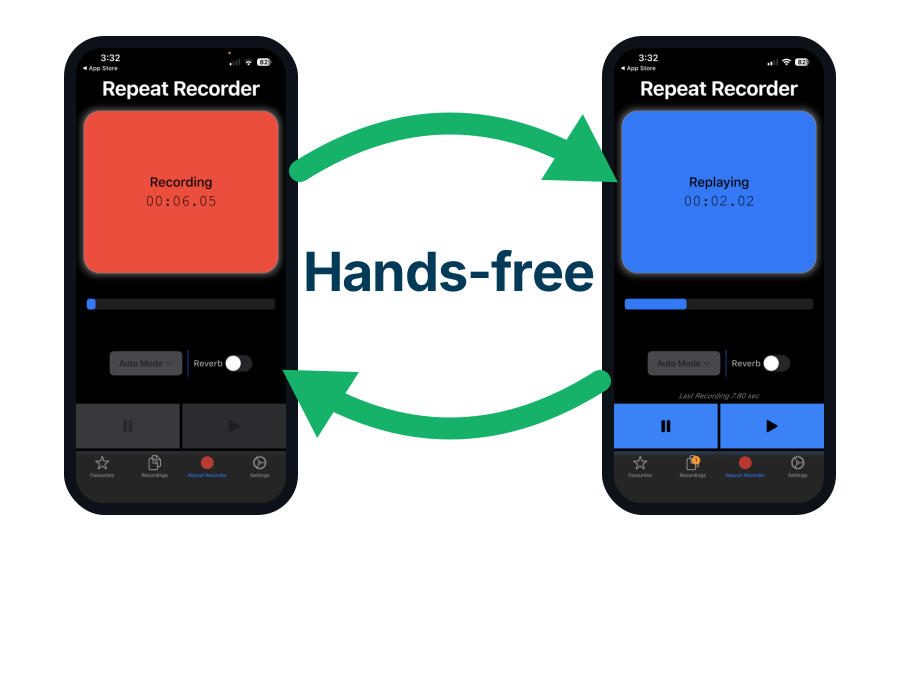
Use Repeat Recorder to stop retakes eating your filming hours
If the ranking system pays you nothing for uploading more often, then posting more only works when the extra videos are genuinely cheaper to make, and on a talking-head video the quiet hours disappear into filming the same sentence over and over until it comes out clean. Repeat Recorder, one of my own apps, records you and plays each take straight back without you touching the phone, so that repetition happens before the camera is rolling instead of after.
- Repeat Recorder plays each take back on its own and then starts recording again, so you can run the same sentence ten times without picking the phone up. That hands-free loop is the whole app. It was built for speech rehearsal, language learning and vocal training, and getting a line right before you film it is the same job with different words.
- Retaking a line until the delivery is perfect sits inside the 8 to 22 hours of work that has no measured effect on clicks or on watch time. Grading, graphics, a second camera angle and perfect takes are the four jobs in that group. Drilling the line on a phone first is the version of that work which costs minutes rather than hours, and it does not add a single frame to the edit.
- Folders you name yourself keep the lines for one video together, and favourites mark the take you settled on. Folders reorder by dragging, so the video you are filming this week sits at the top. Next time you point a camera at yourself you start from the wording that already worked rather than from a blank page.

10% of YouTube videos take 80% of views so more shots wins
If posting more earns you nothing from the algorithm, why does the frequency data look like that? Because of how unevenly views are shared out. Views are not spread around like heights in a crowd, where nearly everyone lands near the average and nobody is ten times the norm. They are spread like lottery winnings, where almost everyone gets nothing and one person gets the lot. That one fact changes what a good strategy looks like.
- Roughly 10% of videos take about 80% of all views. Under 1% of videos ever pass a million. Popularity on YouTube is not merely uneven, it is one of the most lopsided distributions measured on the open web.
- Your typical video does not matter when one upload in thirty carries the channel. If your usual video does 400 views and one in thirty does 20,000, then twenty-nine of your uploads add up to almost nothing and the thirtieth is your entire channel. Your job is not to make your ordinary videos slightly better, it is to reach the thirtieth sooner.
- Every upload is a fresh separate chance at a hit, so more chances win. Because ranking is per video, a video that flops does not use up any allowance you needed for the next one. Twelve videos, each with a 3% chance of being a hit, gives you a 31% chance of at least one. Fifty gives 78%. A hundred gives 95%.
- Four immaculate videos a year is the riskier bet, at an 11% chance of one hit. Four immaculate videos a year, at that same 3%, is an 11% chance of a single hit. To beat twelve rough uploads it is not enough for those four to be better. Each one has to be three times likelier to be a hit, which is a different video rather than a tidier one.
- Nobody can pick which video will be a hit in advance, professionals included. The hit is usually the one nobody expected, which is exactly what you would expect when a few videos take almost everything. If you could reliably identify it beforehand you would simply make that one, and the whole debate would not exist.

Extra editing must quadruple your hits to be worth 4x the time
Logically, if you spend four times longer editing a video, that video has to be four times likelier to be a hit just to come out equal, because in those same hours you could have made four rough ones instead. Those extra hours mean colour grading, b-roll, motion graphics, a second camera angle, background music and retaking a line until the delivery is clean. The idea, the script and the information are identical either way.
- How often your videos turn into hits does not change which strategy wins. Work it through with any figure you like. Whether one video in a hundred is a hit, or one in five, or anything in between, the point where the two strategies come out equal does not move, and it does not move when you change your weekly hours either. All that decides it is how much longer the finished version takes to make. Three hours against twelve means quadrupling. Not lifting your odds. Quadrupling them, from a 3% chance of being a hit to 12%, using nothing but colour grading and a second angle.
- Real editing times push that break-even to somewhere between 7x and 20x. A long-form YouTube video takes 5 to 20 hours to edit, roughly 7 on average, against 30 to 60 minutes for a straight talking-head cut. Worse still, the things measured to move retention are structure, pacing and cutting dead air, all of which are cheap. Grading, motion graphics and multi-camera are not on that list at all, and higher production value has been found to slightly lower perceived trust in face-to-camera content.
- Spending the extra hours on the thumbnail instead of the edit flips the answer. If the extra hours go into the thumbnail, the title and the first 30 seconds instead of into the edit, those hours lift a video far more than four times over, and taking longer wins. That is simply not what most people are doing when they say they are polishing.

Cut the edit, never the thumbnail, title or first 30 seconds
Rough is not one thing. Here is every part of a video you could drop, and what dropping it actually costs.
| Part of the video | Hours it eats | Effect on whether people click | Effect on whether people stay | Verdict |
|---|---|---|---|---|
| The thumbnail | 1 to 2 hours | Very large. Swaps have moved click rate 37% to 110% | None. Nobody sees it after the click | Spend more here |
| The title | Under an hour | Large. About 30% on its own in tests | Some. It sets the promise you have to keep | Spend more here |
| The first 30 seconds | 1 to 2 hours | None. It happens after the click | Very large. It is where the drop-off cliff sits | Spend more here |
| Structure and what you actually say | 1 to 3 hours | None | Very large. The main measured lever on watch time | Keep all of it |
| Cutting dead air and ums | Under an hour in a transcript editor | None | Real. Pace is what holds people mid-video | Keep, it is cheap |
| B-roll and cutaways | 2 to 6 hours | None | Small. Worth something in the opening minute only | A little, early only |
| Shooting in 4K instead of 1080p | Under an hour of extra render and upload | None | None | Harmless either way |
| Motion graphics and animated text | 3 to 8 hours | None | Not measurable | Cut it |
| Colour grading | 1 to 3 hours | None | None | Cut it |
| A second camera angle | 3 to 5 hours of setup and syncing | None | None | Cut it |
| Retakes until the delivery is perfect | 2 to 5 hours | None | None, and high polish can lower trust | Cut it |
| An intro animation | 1 to 2 hours, once | None | Negative. It sits exactly on the drop-off cliff | Cut it |
- The thumbnail and the title are the only things that decide whether anyone clicks. The thumbnail, the title and nothing else. A custom thumbnail runs 60% to 70% ahead of an auto-generated frame, and one documented swap took the same video, same title, same content from 300,000 views to 1.1 million.
- Every expensive editing job has no measured effect on clicks or watch time. Grading, graphics, multi-camera and perfect takes are between 8 and 22 hours combined, and not one of them has a measured effect on click rate or on watch time.
- The editing that does hold viewers is cheap because software does it now. Cutting ums and silences from a transcript takes minutes now, and pacing is the one editing job that genuinely keeps people watching.
- A thumbnail that oversells the video does more harm than leaving it plain. If the thumbnail promises more than the video delivers, you pull in a wave of people who leave within seconds, and people leaving within seconds is the signal that stops YouTube showing it to anyone else. Promise only what the video actually delivers, then deliver it in the first 30 seconds.
- The intro animation is the one edit that actively loses you viewers. It occupies the exact seconds where the largest single drop in the retention graph happens, and it is the same five seconds every time, so returning viewers have already seen it.

A flop does not hurt your channel or your next video
This is the fear that keeps the unfinished video in the folder, and it is the single most expensive myth in the subject.
- YouTube says plainly that a weak video does not hurt your channel. Upload a run of weak videos and then a strong one, and the strong one is still shown to a full test audience of its own. There is no score attached to your channel that your older videos drag down.
- Ranking each video separately is why a flop cannot hurt the next one. The same fact that stops frequency helping you also stops flops hurting you. The system is asking "do the people shown this video watch it", and it asks that fresh every time.
- Copyright strikes and policy breaches hurt a channel, boring videos do not. Copyright strikes, Content ID claims and policy breaches can cost you monetisation or your eligibility to be recommended at all. Those are rule violations. Making something boring is not one.
- Shorts do not drag long-form down either. The two recommendation systems were formally separated, so a Short that goes nowhere does not touch how your long-form is distributed, and viewers who find you in the Shorts feed can be shown your recent long-form.
- The only real cost of a flop is the hours in it. Which is the whole argument in one line: if a miss costs you three hours you can afford to try again, and if it costs you twenty you stop trying.
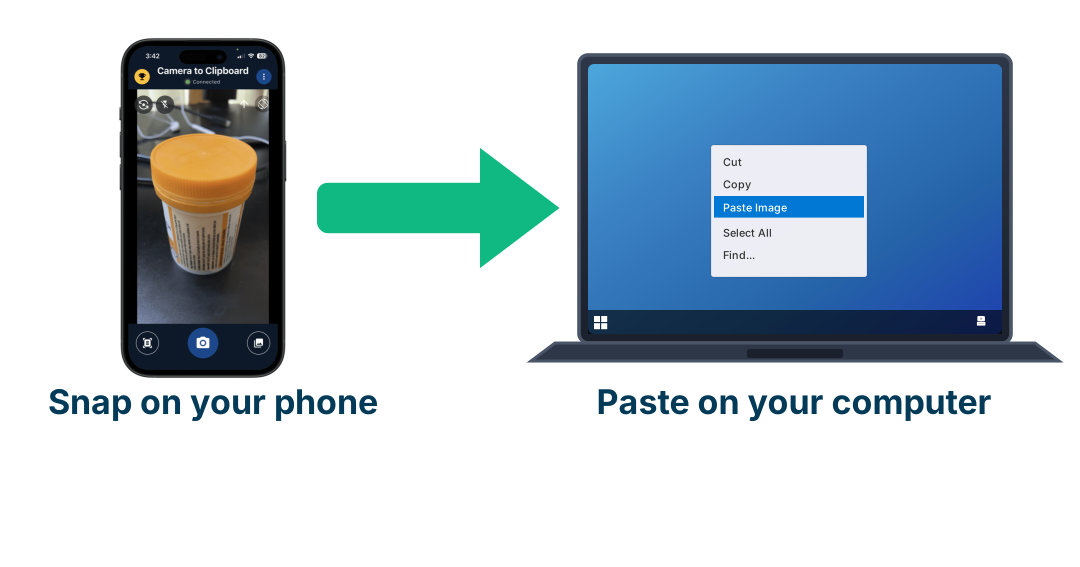
Use Camera to Clipboard to shoot a custom thumbnail in minutes
If the only real cost of a video that goes nowhere is the hours inside it, then every hour has to go where it changes the result, and this article puts the thumbnail at the top of that list. The slow part of making your own thumbnail is almost never taking the picture. It is getting the picture off the phone and into whatever you design in. Camera to Clipboard, another of my own apps, collapses that into one step.
- A photo taken inside Camera to Clipboard is sitting on your computer's clipboard by the time you look up, ready to paste. There is no emailing it to yourself, no cable and no upload to somebody else's website in between. The phone and the computer find each other over your own local network and send the picture straight across.
- A custom thumbnail runs 60% to 70% ahead of a frame YouTube picks for you, and the photo behind it can come out of the phone in your pocket. One documented swap took the same video, same title and same content from 300,000 views to 1.1 million. Pasting into Photoshop or GIMP drops the photo in as a new layer, which is where a thumbnail actually gets built, and Word or Google Docs takes it inline instead.
- Several photos can be sent out of the phone's library at once, so six attempts at the same shot land on the computer together. Picking the strongest frame is a two minute job when all six are side by side and an afternoon when each one has to be fetched separately.

Every subject has a limit and more videos past it lose subscribers
A second study, 18,000 English-language channels analysed by AIR Media-Tech, excluded Shorts and found the opposite of a straight line. Volume helps until it does not, and where it stops depends entirely on what you make.
Not a contradiction. Splitting the same hours into more videos costs you polish, which is cheap. Posting more often than your subscribers want to hear from you costs you your subscribers, which is not.
| Subject | Does volume work here | Median subscribers at the best rate | What posting at the wrong rate costs | Survives a two-week break |
|---|---|---|---|---|
| Gaming | Yes, 20 to 40 a month | 69,800 | Down 25% above 40 a month | Poorly, most gap-sensitive of all |
| Kids and animation | Yes, 20 to 40 a month | 76,600 | Down 34% below 2 a month | Poorly, the library needs feeding |
| Beauty | Somewhat, 10 to 20 a month | 177,000 | Down 57% below 2 a month | Middling |
| Business | Somewhat, 10 to 20 a month | 106,000 | Down 40% above 20 a month | Middling |
| Food and drink | Somewhat, 5 to 10 a month | 136,000 | Down 56% above 40 a month | Middling |
| Health and fitness | No, 2 to 5 a month | 172,000 | Down 55% at 10 to 20 a month, the study's worst | Middling |
| Science and tech | No, 2 to 5 a month | 110,000 | Down 55% above 40 a month | Well, a planned break costs little |
| Education | No, 2 to 5 a month | 116,000 | Down 45% above 40 a month | Well, a planned break costs little |
| Home and DIY | No, 2 to 5 a month | 114,000 | Down 27% below 2 a month | Middling |
| Entertainment | No, 2 to 5 a month | 76,200 | Down 22% below 2 a month | Middling |
| Travel | No, 2 to 5 a month | 60,250 | Down 11% above 40 a month | Well, a planned break costs little |
- Over-posting costs more than under-posting in the worst case. The typical health and fitness channel posting 10 to 20 videos a month had 55% fewer subscribers in total than the typical one posting 2 to 5. Not 55% fewer new subscribers that month, 55% fewer altogether, and it is the study's biggest gap. Post too often and your subscribers get tired of you and stop opening your videos, and once your own subscribers stop opening them, YouTube stops showing them to anyone else.
- Under-posting is still the more common way to fail. In every single subject, channels below 2 videos a month had fewer subscribers than the middle of their group. Even where the limit is low, posting too little is worse.
- Only gaming and kids content genuinely reward high upload volume. Gaming and kids content are consumed in long sessions from a deep library, so more uploads means more to autoplay next. Nobody binges eleven travel documentaries.
- A regular schedule beat raw upload volume inside every subject. Channels posting the same number of videos on a regular schedule got more views per subscriber than channels posting the same number on random days.
- The vidIQ and AIR studies disagree because they measured different things. One counted Shorts and tracked growth rate; the other excluded Shorts and compared how many subscribers channels had on one day. Cheap formats fill the high-frequency tiers of the first study, so "12 or more a month" means Shorts there and means an exhausted documentary maker here. Read the first as the case for posting more and the second as the case for a limit, because both are true.
Your first 40 videos are training, not your portfolio
The second mechanism behind the frequency data is not statistical at all. It is that you get better by shipping, and you cannot ship four times a year and improve.
- 68% of channels that reached 1,000 subscribers did it after their 40th video. Only around 10% got there in under ten uploads, and those almost always arrived with an audience from somewhere else.
- MrBeast tells creators to make 100 videos before expecting a good one. His actual advice is to make 100 videos and improve one specific thing each time, so that the 101st is good. That is not a contradiction, it is simply which one comes first. The quality he is famous for was paid for in repetition.
- Publishing more videos improves your thumbnails, hooks and pacing, and more editing does not. Your instinct for a thumbnail, your first sentence and your sense of when a section is boring only sharpen against new audiences. None of them improve by spending eight more hours in the timeline of a single video, because the same video gives you no new feedback.
- Four videos a year gives you only four chances a year to learn anything. No craft has ever been learned at four attempts a year. That is the real, uncounted cost of polishing early, and every year you do it you fall further behind.
- In the pottery class parable, the best pots came from the quantity group. In the story from Art & Fear, a ceramics teacher graded half the class purely on the weight of pots produced and the other half on a single perfect pot. The best pots all came from the quantity half, who learned by making, while the quality half theorised. It is a parable rather than a controlled study, borrowed from a real photography teacher, and it survives because everyone who has ever shipped anything recognises it.
Use Repeat Recorder to improve your delivery between uploads
Shipping is what teaches you thumbnails and pacing, and 68% of channels needed more than 40 videos to reach 1,000 subscribers. Your delivery is the one part of that list you can work on without publishing anything, because a sentence gives you feedback the moment you hear it back. Repeat Recorder, one of my own apps, exists to give you that playback over and over without you touching the phone.
- MrBeast tells creators to make 100 videos and improve one thing each time, and the same instruction works on a single sentence. Repeat Recorder records you, plays the take back and starts recording again on its own, so twenty attempts at the same opening line take about ten minutes rather than twenty uploads.
- Your first 30 seconds is one of the three things this article says is worth the hours, alongside the thumbnail and the title. It is also the only one of the three you deliver out loud, and hearing it played straight back is what catches thirty seconds of throat clearing before the point arrives.
- Two versions of the same opening can sit side by side in favourites and in a folder you named yourself. Recording a line twice and keeping the better one is the cheapest test in this article, and unlike anything you publish it answers you in about a minute.
Burnout ends more YouTube channels than bad videos do
Everything above argues for more volume. This is the one force that reliably takes it back, and it is the reason the honest answer is not simply "post as much as physically possible".
- 52% of creators report having experienced burnout and 37% have considered leaving over it. Other 2025 surveys put the figure as high as 78% once you include people whose motivation and health were affected without them quitting.
- Creative fatigue causes 40% of creator burnout, more than any other reason, ahead of workload at 31% and screen time at 27%. Ranked by severity rather than frequency, financial instability comes first at 55%, which is why the middle of the growth curve is the dangerous stretch: enough work to be a job, not enough income to be one.
- Every published daily-upload experiment ends with the gains falling back. Watch time climbs through the month, then falls back once the creator returns to weekly. A 30-day burst is a burst, and treating its results as a permanent schedule is how people end up at a rate they cannot keep up.
- The right upload rate is the fastest one you can keep up for a whole year. Not the fastest one you can hold for a month. A year at 4 a month beats three months at 12 a month followed by silence, and the frequency data is a study of channels that were still posting.
- Not dreading your own work is the real reason to keep some polish. If publishing something you find embarrassing makes you dread the work, the embarrassment is a cost even though the algorithm never charges you for it. Cut polish to the point where the work stays enjoyable, and no further.
Conclusion: whether to post more or post better on YouTube
- Posting more wins, but not because the algorithm rewards frequency. Channels posting 12 or more a month grew views 4.1 times faster than those posting less than monthly, across 10.2 million of them. Upload frequency is not a ranking factor and YouTube says so plainly. More videos win because roughly 10% of videos take 80% of the views, so almost all of a channel's views come from a few hits, and every upload is a fresh separate chance at one.
- Taking four times longer to edit must make the video four times likelier to be a hit. Anything less and you would have been better off making four rough videos in those same hours, and that holds whatever your usual success rate is. The things that could do that (thumbnail, title, first 30 seconds) cost about two hours; the things that cost eight to twenty hours (grading, graphics, second camera, perfect takes) do not move clicks or watch time at all.
- Post as often as your subject can take, and find the time by editing less. Gaming and kids reward 20 to 40 a month; science, education, health, home, entertainment and travel peak at 2 to 5, and the typical health and fitness channel posting 10 to 20 a month had 55% fewer subscribers than the typical one posting 2 to 5. Pick the fastest rate you can keep up for a year, then find those hours by editing less, never by rushing the thumbnail or the title.